

Success Story
Program Sustainability in Action
Higher Education
What happens when 57% of a school's revenue disappears overnight due to federal policy changes — and leadership has no course-level visibility to respond? This case study explores how Indiana University's Luddy School of Informatics, Computing, and Engineering partnered with Tru and Anaplan to build a connected program sustainability model — giving leaders the data to act on what's working, address what isn't, and plan with confidence through uncertainty.
Industry
Higher Education
Platform
Anaplan
Use Case
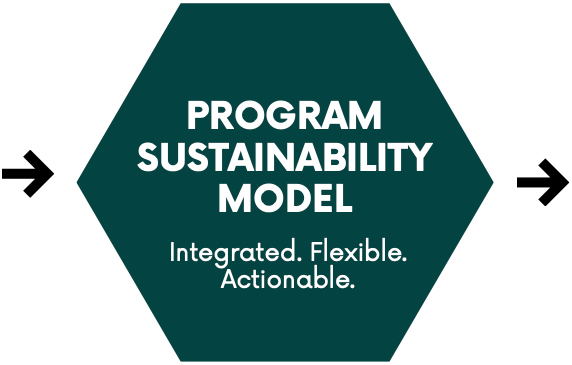
Program Sustainability
Connect With an Expert
The Challenge
Higher education leaders face faster, higher-stakes decisions amid shifting enrollment and growing financial pressure.
At Indiana University Luddy School, 57% of revenue from international graduate students disappeared due to federal policy changes. Leadership had no course-level visibility to respond. As Mike Noth described:
“As the driver, I knew I had blind spots. I needed a solution to help me identify them.”
Mike Noth, Assistant Dean for Finance
The Solution
Working with Tru Consulting, IU built a flexible operating model using Anaplan, connecting financial data with academic activity at the course level—introducing contribution margin visibility and enabling scenario-based planning.
One integrated model. All the data that matters. Clear insights that drive better decisions.
Key Capabilities
Course Performance Insights
Identify thriving and underperforming courses to drive growth, optimization, or redesign.
Faculty Transition Planning
Make informed decisions when faculty depart— reassign, consolidate, or reevaluate courses based on priorities.
Flexible Overhead Allocation
Analyze program performance using multiple financial lenses with configurable cost allocation methods.
Comprehensive Faculty Effort Allocation
Capture teaching, research, and service contributions for a more accurate understanding of instructional costs.
Human Resources Optimization
Align faculty compensation, teaching load, and class size to better understand course economics and optimize assignments.
Actionable Insights & Reporting
Identify core vs. elective courses and evaluate elective viability
Analyze program performance across departments with flexible rollups
Identify courses where the year-over-year change exceeds 20%
Highlight courses with more than 25% margin variance across costing methods
Identify high-performing small classes and underperforming large ones
Surface profitability and loss patterns to guide strategic decisions
Faster Decision Cycles
Make program-level decisions with speed and confidence.
Clear Visibility
Gain transparency into course-level economics and performance.
Improved Alignment
Optimize faculty allocation and workload with data-driven insights.
Early Risk Detection
Identify revenue, enrollment, and margin risks earlier.
Stronger Outcomes
Align academic strategy with financial sustainability and student value.
The Model: Connecting What Matters
DATA INPUTS
Academic Data
- Courses, enrollments, grades, program structure
Financial Data
- Revenue, costs, budgets, overhead allocations
Human Resources Data
- Faculty roles, compensation, effort, workload, class size
STRATEGIC OUTPUTS
Program Performance
- Holistic view of academic and financial health
Faculty Planning
- Data-driven faculty needs and assignment strategy
Course Decisions
- Optimize, redesign, or sunset with confidence
Sustainable Growth
- Align resources to mission and student success
The Impact

"The greatest benefit of these models is helping us make informed decisions, see the whole picture, and giving us the data to put together the puzzle. This now allows us to take action on winners and those that are not doing well—making decisions on new course offerings, faculty needs, and continuing to improve the student value equation."
Mike Noth, Assistant Dean for Finance
Economic Signals The Model Surfaces
Enrollment & Demand Shifts
Track changes in enrollment patterns and their financial impact.
Margin Variance (>25%)
Identify courses or programs with margin variance across costing methods.
YoY Performance Changes (>20%)
Quickly flag courses with significant year-over-year change.
Class Size Efficiency
Spot high-performing small classes and underperforming large ones.
Profitability & Loss Patterns
Surface recurring profitability or loss trends to guide resource allocation.
Faculty Economics Alignment
Understand the impact of compensation, load, and effort on course economics.